Disclaimer: The data used in this tool have not been reviewed by the U.S. Army Corps of Engineers. The tool should be used for academic purposes only as it is continually being improved. The tool is best viewed in Chrome, Firefox, Microsoft Edge, and Safari browsers. It does not work with Internet Explorer.
The map shows the location of U.S. Army Corps of Engineers reservoirs and their associated water levels through time. The original analysis, map legends, and paper used provisional, unreviewed data obtained from Corps districts up to September 30, 2015. You may change the dates below the plots to match the original analysis. Elevation and storage volumes have been added when available through January 2024 from the Corps web portal with minimal cleaning. No adjustments have been made for changes to operational targets or relationships between elevation and storage volumes.
Use the grey sidebar on the left to change the legend and filter reservoirs displayed on the map. Click on any reservoir in the map to see analysis results for that reservoir in the tabbed panels below. Change the time period for the analysis by typing in a year and clicking the submit (option located below the tabbed panels). Short descriptions of each analysis are provided within the tab.
Operational targets (also known as rule curves or guide curves) are the management goals for reservoir levels throughout a year as described in publicly discoverable and accessible water control plans. Further details are contained in the Nicholas Institute report, Creating Data as a Service for U.S. Army Corps of Engineers Reservoirs.
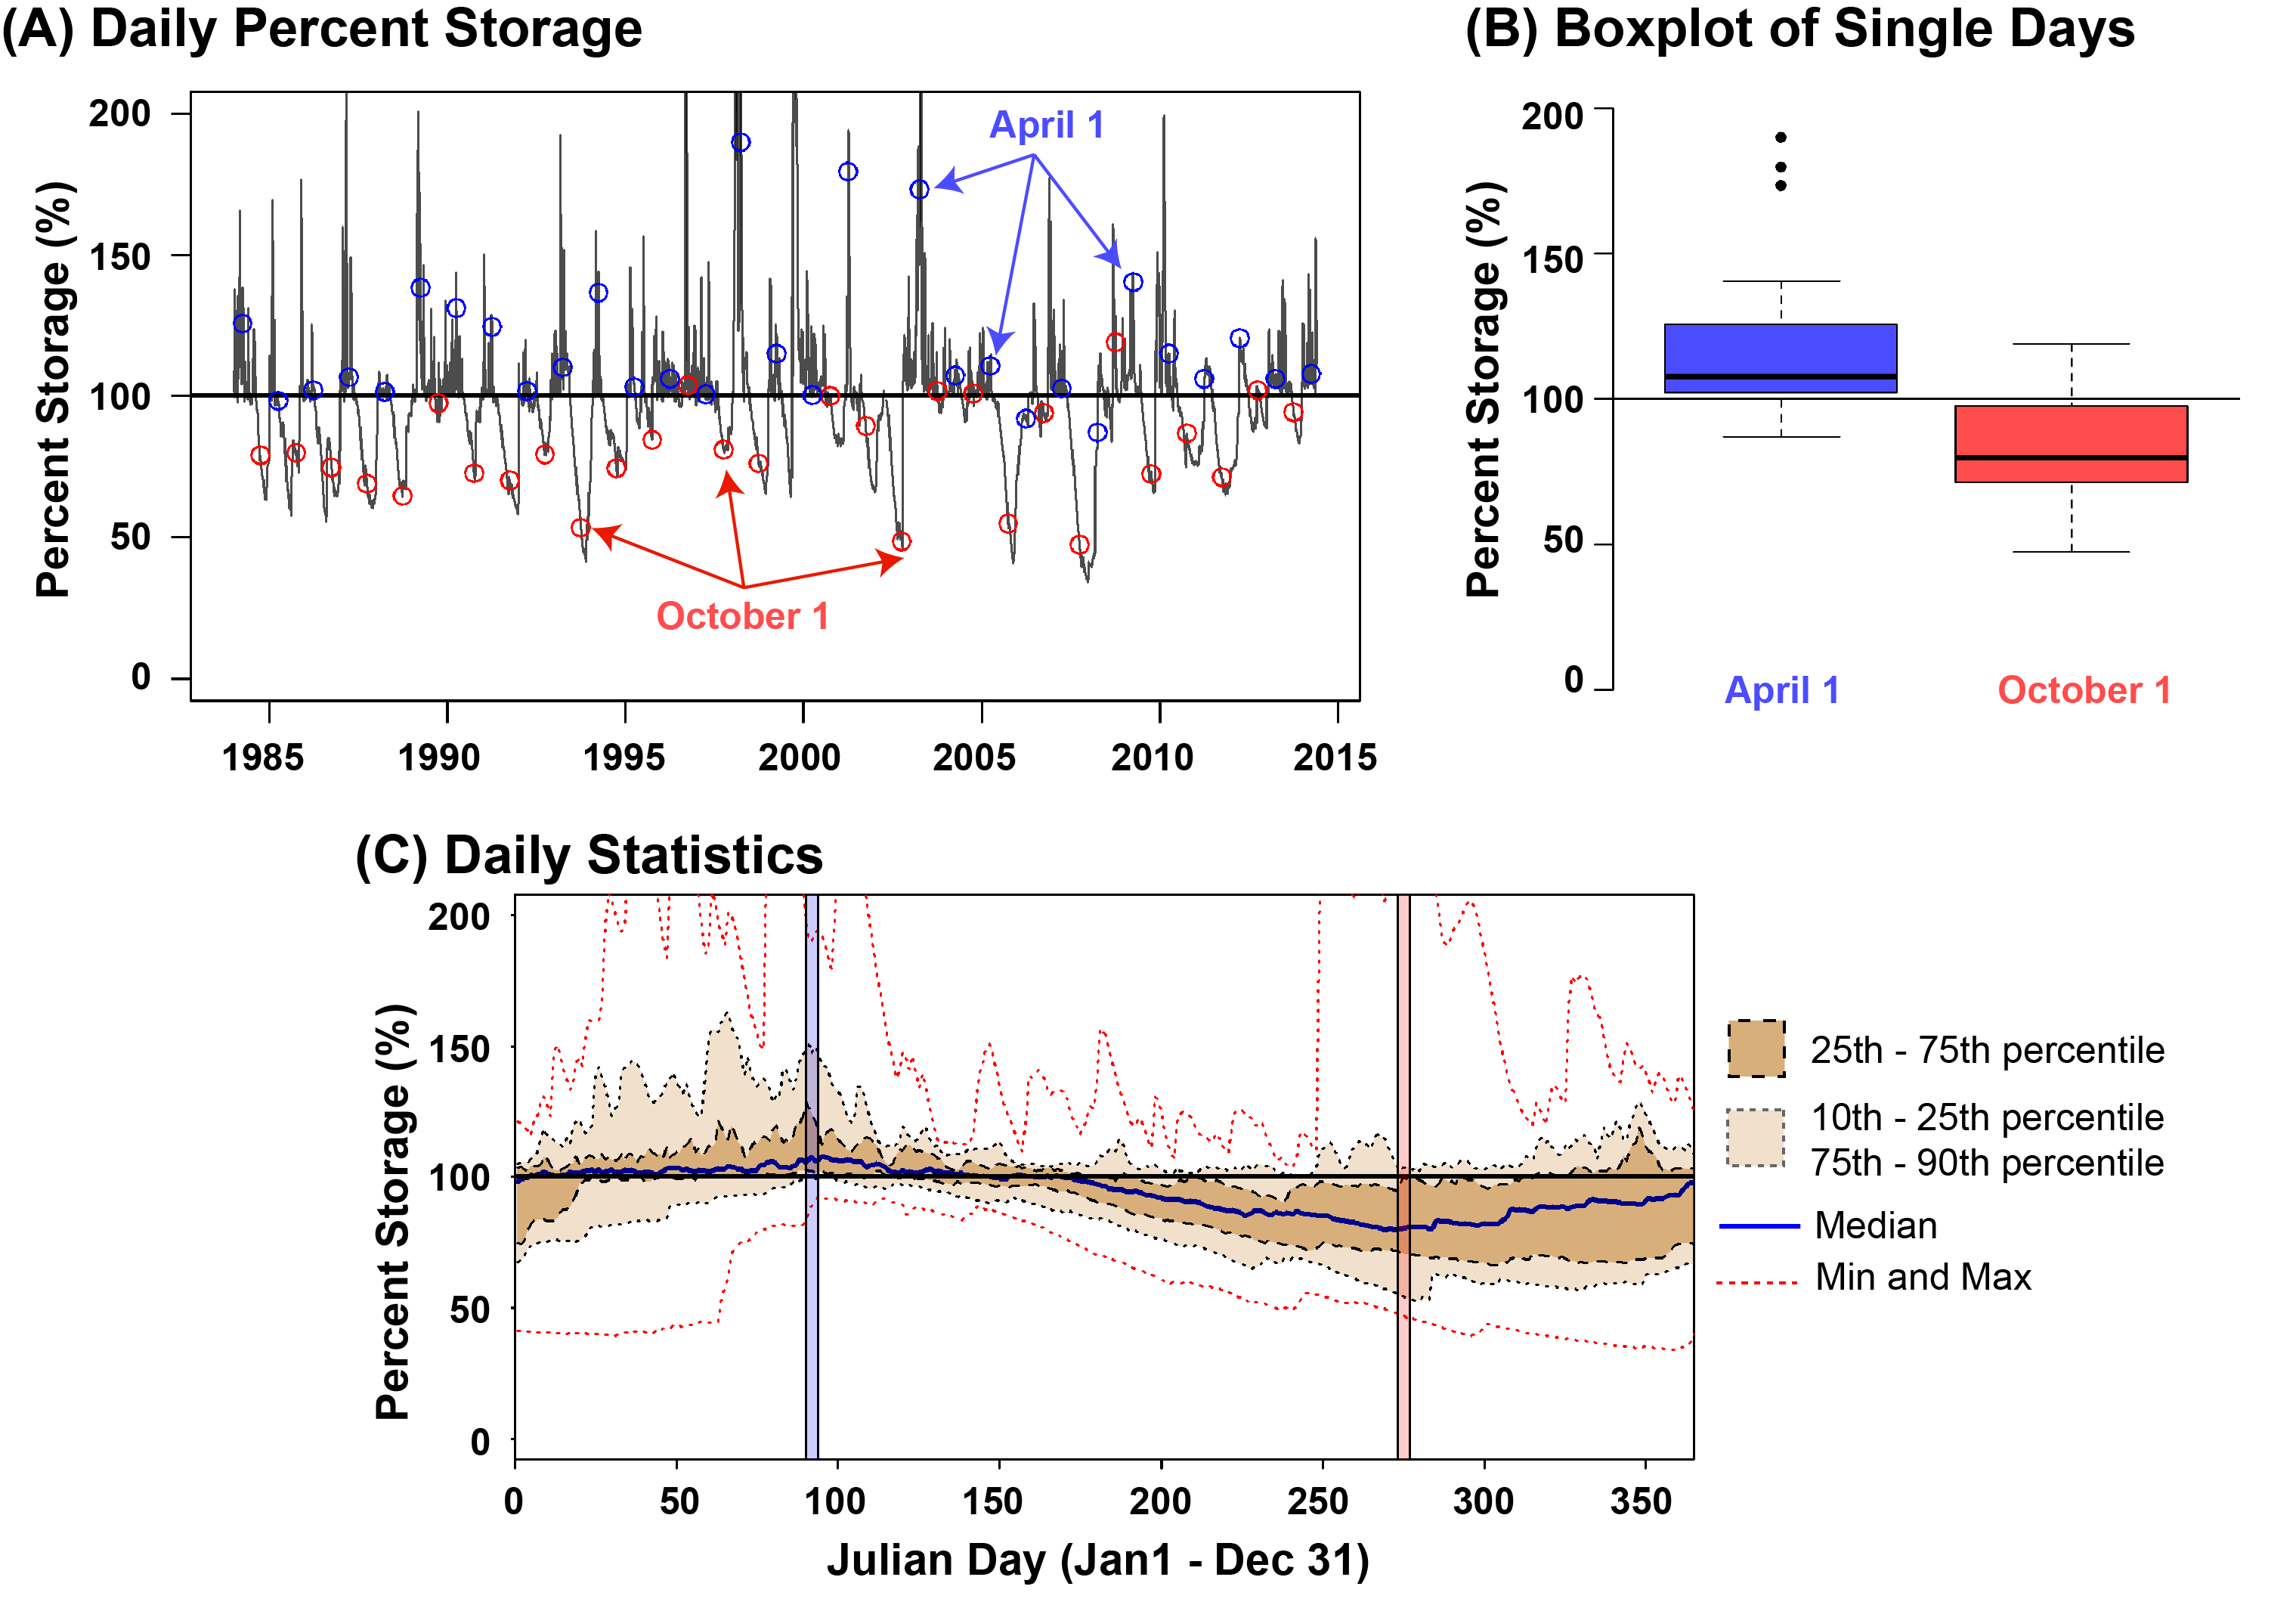
Over Under displays the lake elevation relative to the operational target. Click here for more information:
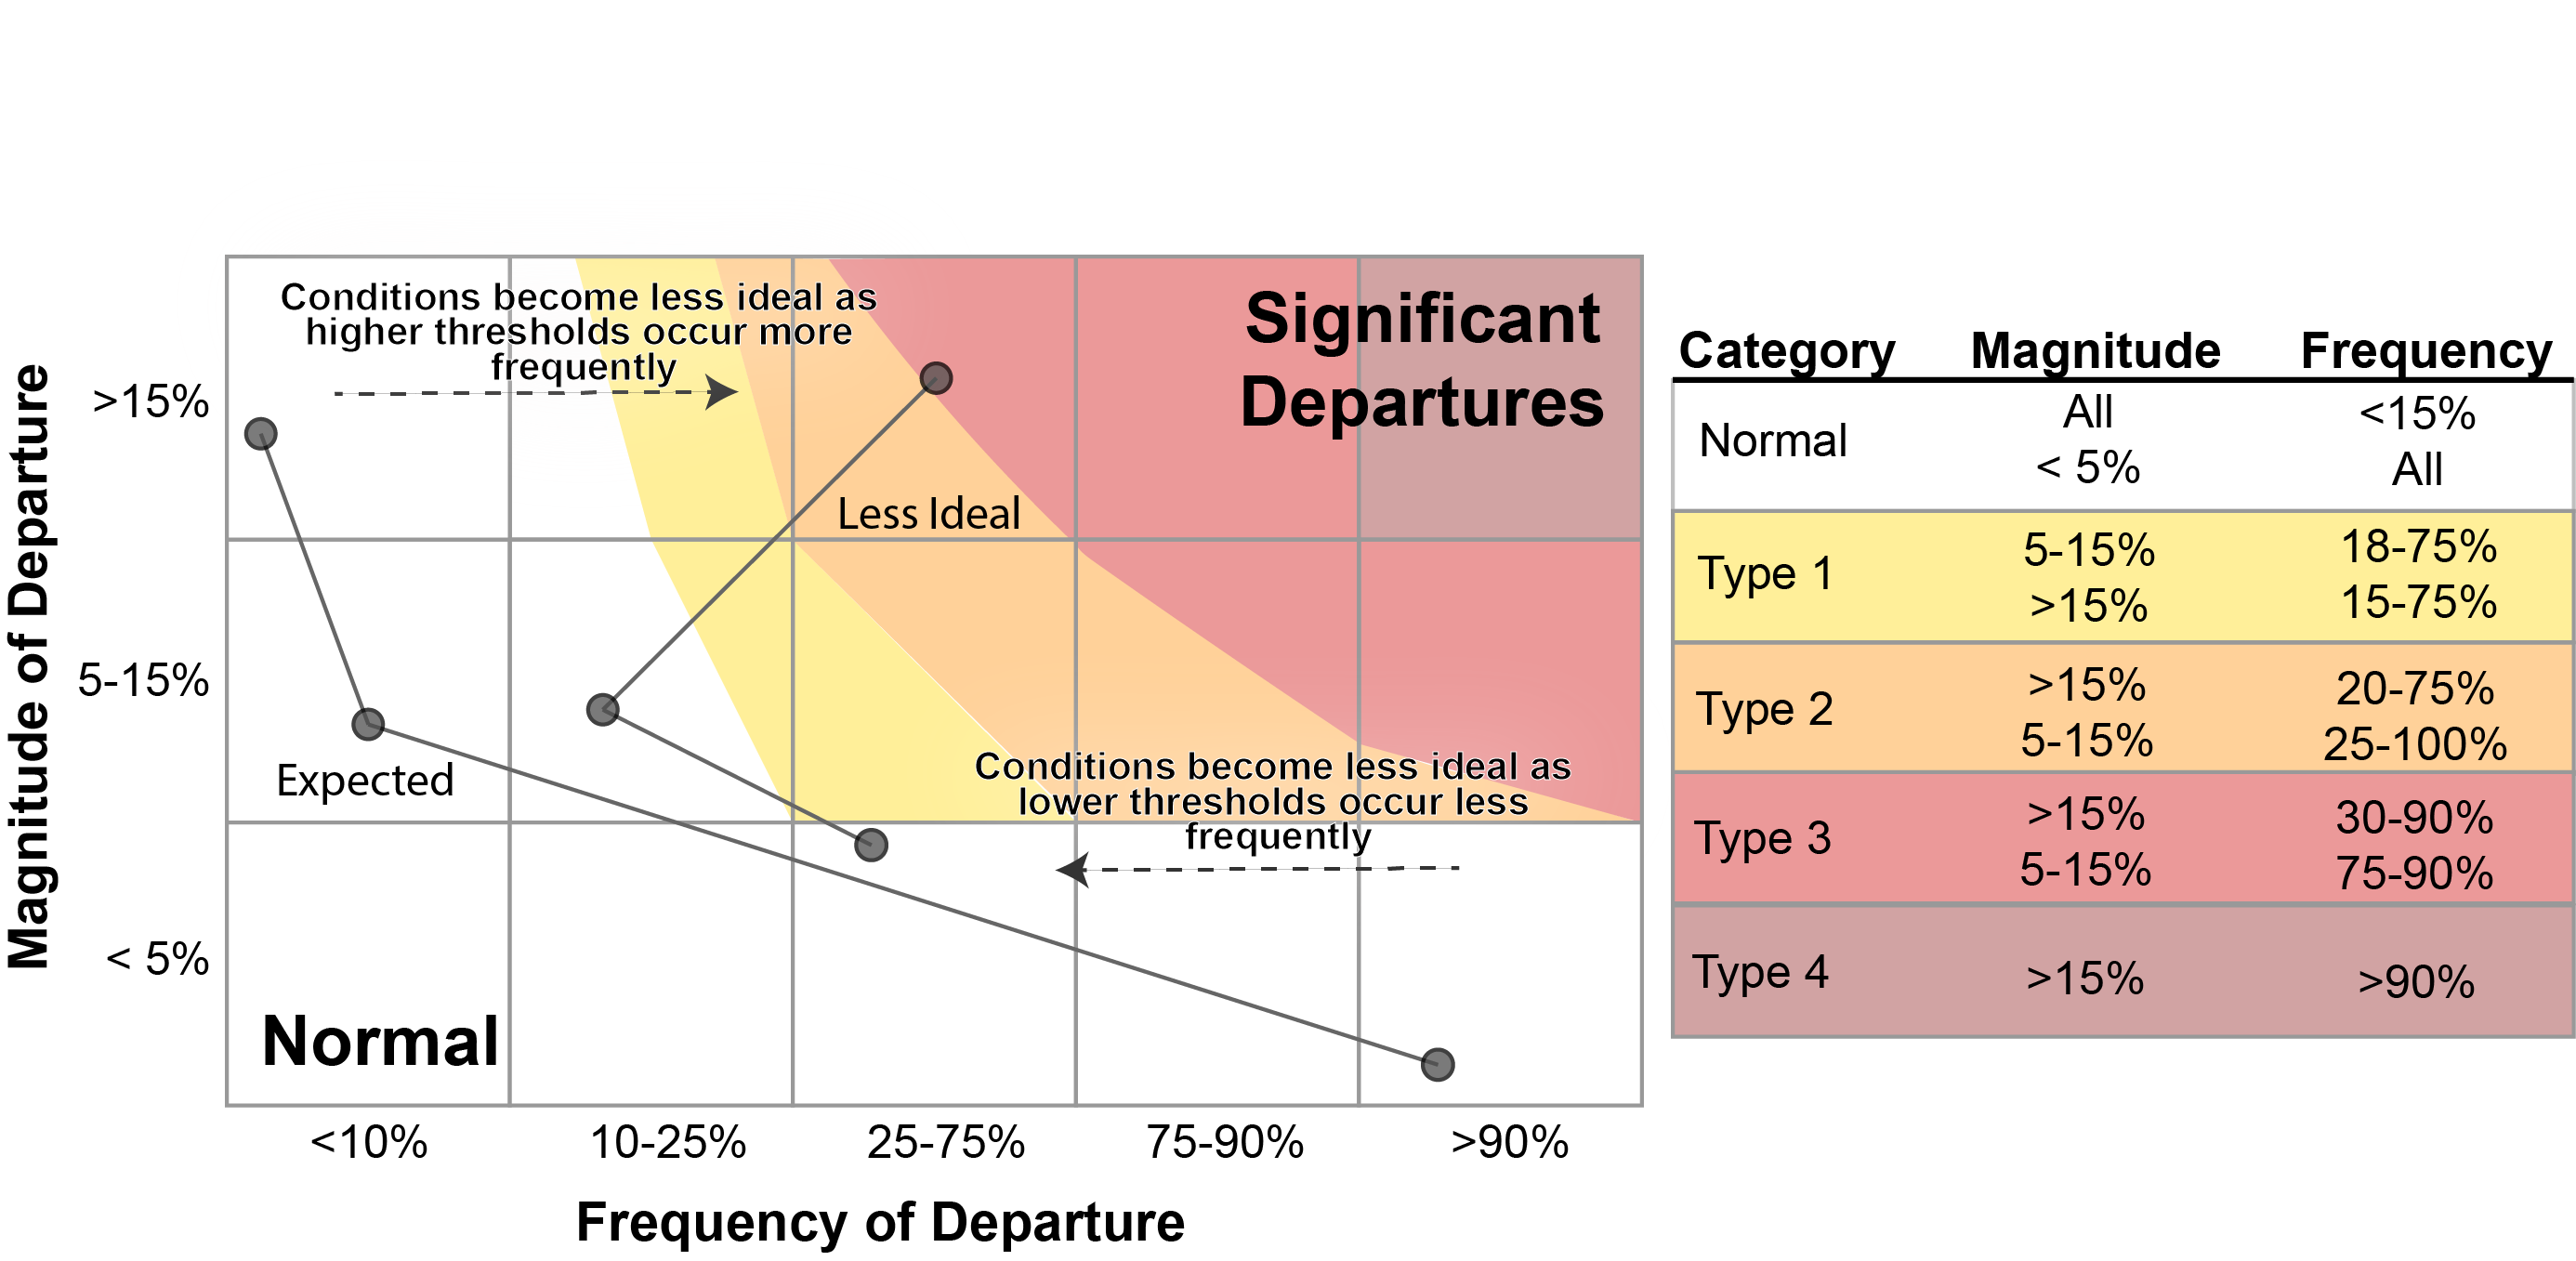
Systematic Departures display summary statistics of storage volume relative to operational targets throughout the year. Click here for more information:
Storage duration curves displays the frequency of storage volume relative to operational targets over time. Click here for more information:
Operational departures over time displays the cumulative sum of departures from the operational target over time. The palmer drought severity index for the climate division of the reservoir is overlayed. Click here for more information:
The matrix combines magnitude of departure with the frequency of departure. The operational target was used for the web version of the analysis and does not include operational target bands or min/max drawdowns for reservoirs with variable operational targets (predominantly the Northwest Division). Click here for more information:
Disclaimer: Data are available for download in CSV format. The data used in this tool are provisional and have not been vetted by the U.S. Army Corps of Engineers. The U.S. Army Corps of Engineers will release the authoritative data in the future. Please contact us if an error is located in the data so this tool can be continually improved.This work was funded by an IPA from the U.S. Army Corps of Engineers Institute for Water Resources.