
There are many challenges facing water providers today. Multi-year droughts in the West that have left rural communities without access to water. Lack of access to proper sanitation has led to the return of tropical parasites in the South. Affordability challenges can lead to shutoffs and the loss of access to water. Lead contamination crises, PFAS, and water quality crises have eroded the trust of many communities in the safety of their water. Communities facing the greatest water stress and threat to water security include dis-invested urban areas, rural areas, unincorporated areas, and Native American lands.
Water has been described as a “wicked problem”, which means it is complicated. Untangling these problems is like untangling a large ball of string that is full of knots. You pull on one strand to loosen the knot and it tightens in another area. We need to work on the knots, but first let’s look at how some of these knots (i.e. water challenges) formed and how they are connected. Here, we are going to look at how water services are provided, how we pay for services, and the equity and affordability of those services.
What are water services?
There are three main types of water services:
A customer may receive these three services from a single provider or multiple providers.
Who provides water services?
Governments, cooperatives, private companies, and individual households provide water services. Aside from individual households, most of these entities are referred to as utilities that own and operate water systems that deliver services. Systems and utilities are often used interchangeably. However, the Environmental Protection Agency (EPA) uses specific terminology. The EPA regulates water systems and a water utility may be made up of a collection of several water systems. You may also be familiar with the term Community Water Systems, which refer to systems that connect with at least 25 residents and provide services throughout the year. Most (88%) community water systems are publicly owned.
Publicly Owned Systems
Most water utilities are owned by local governments, such a municipalities (eg. cities and towns), counties, or special districts. Within a municipality or county, the water utilities can be embedded within a department (e.g. public works) or operated separately. Special districts, which are also referred to as authorities, also own water utilities. For example:
Federal or state governments may own community water systems if the previous owner was failing to provide safe, reliable services.
Privately Owned Systems
There are different types of privately owned systems. Three common types include:
Why are there so many water service providers?
Two major reasons for so many local utilities:
(more than 16 per county)
(almost 5 per county)
(not including unfunded programs)
Estimates from 2017 to 2020
However, there are far more utilities than required by geography.
A single household may be served by three separate water utilities even though it is all the same water.
Even a single service - such as drinking water - may involve several utilities. For example, one utility might withdraw water and sell that water to many different utilities in the area who treat and distribute water. Similarly, a wastewater utility may collect wastewater from the community and then pay another utility to treat and return wastewater to the environment.
There are efforts to consolidate some utility functions (such as data, management, technology, and financing) to enable managing this One Water more effectively. In some areas, there is a desire to consolidate utilities to create a One utility (this may include telecoms, energy, and other utilities) to improve planning and lower infrastructure costs.
What do water service providers do?
Drinking water utilities have three primary functions:
All of these functions require infrastructure (treatment plants, pipes, tanks, and so on) that must be built, maintained, and replaced over time.
Wastewater utilities have the same functions as drinking water utilities, just in reverse order:
All of these functions require infrastructure (treatment plants, pipes, tanks, and so on) that must be built, maintained, and replaced over time.
Stormwater (drainage) utilities are primarily trying to improve drainage in the community in order to reduce flooding and remove contaminants before entering streams. Stormwater utilities may:
In older cities, stormwater utilities may be needed to separate pipes shared with wastewater utilities. During large rain events, these pipes can fill and overflow, result in raw sewage mixed with rain escaping treatment and flowing into neighborhoods and business areas. These are often known as "Combined Sewer Overflows" (CSO). Many towns and cities do not have an official stormwater utility (collecting fees), but carry out these functions through programs within other departments, such as public works and transportation. A 2017 Brookings Report provides a map and some details about stormwater utilities in the U.S.
Stormwater utilities are often formed when there is a need for greater technical and financial capacity to address runoff challenges that come from impervious surfaces (e.g. roads, buildings, sidewalks) that prevent water from soaking into the ground after rain and snow events. Instead, water "runs off" quickly downhill into culverts and streams. This can result in flooding and poor water quality since there is limited contact with soils and vegetation to filter the water before it enters our waterways.
Why do we spend so much effort treating water?
In the 1960s and 1970s, environmental protection was coming into public awareness. Visible signs of pollution (including the Cuyahoga River catching fire 13 times) captured the public's attention. Studies were showing that 40% of drinking water systems were not meeting public health guidelines for water. This growing awareness created the political will for the federal government to take a more substantive role to protect public and environmental health. In the 1970s the federal government passed the Clean Water Act (CWA) and the Safe Drinking Water Act (SDWA).
Although they manage water separately, both the CWA and SDWA act:
Both acts focus on treating already polluted water rather than addressing the sources of pollution. This is a far more expensive route. Expenses are also rising as we are discovering the presence of medicines, chemicals, nutrients, and so on that were previously undetected. These emerging contaminants may negatively impact human health and require water service providers to invest in new treatment technologies. How we regulate water matters and must be able to adapt so that public health is protected from emerging contaminants, water quality is safe for the environment, and the costs of treatment and regulation are affordable.
There is a lot to unpack about both these acts, how they work, and how they have been amended over time. You can read summaries of these acts in the 2019 Aspen-Nicholas Water Forum Report.
Why do water services cost money?
Water is essential to life… just like air… so why do we pay for water?
One response is that we are not paying for water, but we are paying to have the water withdrawn, treated, delivered to our house, taken away, treated again, and released into the environment. We are paying for these services and not for the water itself. Households that have their own wells and septic systems have to pay for that infrastructure and its maintenance. That is what we are paying for when we pay our water bills. In contrast, we do not need infrastructure to access air (though air filters are a decentralized infrastructure that individuals purchase to clean the air they breath in enclosed spaces such as homes and cars). Water is much heavier than air, concentrated in specific places, and many need centralized infrastructure to access, treat, and distribute water (see what do water service providers do).
There is a long-standing debate around whether water is a public good or a private commodity, and consequently whether all people in a community should be guaranteed access to water or if they must buy access.
Water can be considered a public good because it is essential for life and economic prosperity. Public goods are present when the benefits to the public are non-excludable, meaning everyone benefits from an activity (e.g. everyone downstream of a dam benefits from flood protection). Large-scale water infrastructure (e.g., dams and levees) provide public goods such as navigation, flood protection, water supply, and recreation. Water, used in this manner, is a common pool resource that can be used by many for different purposes. Because of these broadly distributed benefits, the federal government often funds large-scale water infrastructure.
Water itself, as opposed to large-scale infrastructure, behaves more like a commodity because it is finite, excludable (meaning different people cannot drink the same glass of water), and dispersed geographically (contained in watersheds and aquifers). This description more aptly describes the beneficiaries of local water services infrastructure (e.g. drinking water and wastewater) where the benefits are largely constrained to the scale of a community (although downstream communities are impacted by decisions made upstream). Those benefiting from local services fund drinking water and wastewater infrastructure through fees tied directly to the services provided. Here, water services are a “local public good” because they are provided to the community (public good), but are funded through direct payment from customers based on usage (commodity).
Households or individuals without access to public water and sewer systems rely on bottled water (solely a commodity), private wells, and septic systems. Water as a commodity, particularly bottled water, is incredibly expensive compared to water as a local public good.
How do utilities charge customers?
Most of the revenue utilities generate comes from their customers. The bill sent to customers is based on the utilities “rate structures”. Rate structures are designed to do many things, such as recover the costs of providing service, encourage conservation, minimize administrative burden, and/or ensure affordability. Rate structures are used to calculate a bill that is sent to their customers regularly: monthly, every other month (bi-monthly), every three months (quarterly), twice a year, or once a year.
Drinking water and wastewater rate structures are often comprised of the following components: fixed charges, usage charges, and surcharges. A utility may use only one component or all three components.
Fixed Charge (also referred to as service or base charges)
This part of a bill is the same each billing period. The fixed charge reflects that some of the costs of providing water services do not change no matter how much water a customer uses, such as ongoing maintenance on the water mains, pipes, and pumps. Fixed costs may depend on customer type (e.g. residential, multifamily, commercial, industrial) or the meter size (often measured in inches). Utilities without metered water use, or utilities where wastewater utilities do not have access to metered drinking water utility data, may use a fixed charge to recover all costs of service. For stormwater, there may be a fixed cost for each single-family residential home, often depending on the size of the household or the impervious area.
Usage Charge (also referred to as volumetric, variable, or commodity charges)
The amount billed each month changes depending on how much water a customer uses. Every gallon of water used has to be stored, pumped, cleaned, treated, and delivered to customers. Usage charges are typically based on a cost for some unit of water (thousand gallons or hundred cubic feet) used by the household. Usage costs may include all water used or may begin after an initial volume of water that is included in the fixed charge. For example, the fixed charge might include the first 2,000 gallons of water used, meaning customers only have to pay when they use more than 2,000 gallons in a billing cycle.
Cost | Start at | End at |
---|---|---|
$4.00 per 1,000 gallons | 0 gallons | max usage |
Cost ($ per 1,000 gallons) | Start at (gallons) | End at (gallons) |
---|---|---|
$2.00 | 0 | 4,000 |
$4.00 | 4,001 | 8,000 |
$6.00 | 8,001 | 50,000 |
$12.00 | 50,001 | max usage |
Cost ($ per 1,000 gallons) | Start at (gallons) | End at (gallons) |
---|---|---|
$6.00 | 0 | 4,000 |
$4.00 | 4,001 | 8,000 |
$2.00 | 8,001 | 50,000 |
$1.00 | 50,001 | max usage |
Cost ($) | Start at (square feet) | End at (square feet) |
---|---|---|
$4.00 | 0 | 10,000 |
$10.00 | 10,001 | 20,000 |
$20.00 | 20,001 | max size |
Surcharges
These may also be additional costs that are temporary or beyond the direct control of the utility (e.g., a
utility purchases water from another utility, sometimes called a pass-through or pass-by fee). Surcharges may be fixed, for example, each household pays an extra $2 per month to cover a debt payment. Surcharges may be based on water usage, such as paying $1.25 per 1,000 gallons to pay for another utility to treat wastewater.
The estimated bill for a household for a single service:
Total Bill for A Service = Fixed Charges + Commodity Charges + Surcharges
The estimated bill for a household for all water services:
Total Bill = Total Bill Drinking Water + Total Bill Wastewater + Total Bill Stormwater
How do utilities finance infrastructure?
Financing is how we borrow money to pay for expensive things upfront (like a loan for a car, a mortgage for a home, etc.). Funding refers to how we generate money to pay for things over time (e.g. gas in the car, home repairs, and the loans or debt used to purchase the car or home).
The same is true for utilities. Utilities finance expensive infrastructure projects (like building a treatment plant or extending pipes to new neighborhoods) through loans (and sometimes grants that do not need to be paid back). These loans may come from the government or from the municipal bond market (private investors). The utilities finance daily operations and pay the debt from these infrastructure projects by revenues generated from their customers (residents and businesses).
Prior to the 1990s, the municipal bond market for water utilities was small. However, some policy changes increased the use of bonds with over 100 billion USD for water and sewer utilities each year since 2000. Bonds work similarly to loans where a utility borrows money from the market (private investors) and must repay the debt + interest over time. The federal response to the 2008 and 2020 financial crises has been to reduce federal interest rates, which has resulted in very low interest rates in the market that reduce the costs of borrowing. Additionally, municipal bonds are tax exempt, which has also driven the use of municipal bonds, although this advantage has declined as federal tax rates have been reduced. Many utilities have increasingly relied on municipal bonds, which exposes the utilities to risk from market and economic trends. Risk comes from interest rates, credit ratings, tax policy revisions, increased investor demand, and multiple financial crises.
Figure comes from Smull et al. paper in review (link will be added once available)
Why do the costs of water services vary between utilities?
While water services have the same primary tasks: (collect water, treat water, and distribute water), the costs of performing those tasks varies. Geography matters.
Distance. It is cheaper for utilities when the water source and their customers are located nearby. As the distance between water sources and customers grow, the energy costs to pump water those distances increases.
Elevation. Water is expensive to pump up from below the ground or to push to customers located at higher elevations. As the elevation (vertical distance) between where the water starts and its destination increases, the cost to move water increases.
Treatment. Not all water is of the same quality. Water with more contaminants or located in warmer climates (things love to grow in warm water) often must spend more to treat water to safe drinking water standards or to return wastewater to streams. Utilities located farthest downstream have to clean all the pollutants entering waterways upstream and often have to spend much more to treat water. This is part of the challenge of regulating water only by treating water at the source and not preventing pollution.
Availability. Not all areas have excess water. The western U.S. has water rights to determine who gets access to how much water when there is not enough to go around. Droughts often cause the cost of water to increase because the demand for water is greater than the supply. Additionally, some utilities do not have direct access to water and must purchase their water from other systems. While a utility has control of the costs of maintaining and operating infrastructure, they have less control over the cost of purchasing water or sending wastewater for treatment.
Peak Demand. All of us use a certain amount of water each day for drinking, cooking, cleaning, sanitation, and so on. Often, in warmer months, we use a lot more water for lawns and energy. This extra water use during some months and days is called peak demand. Utilities must build infrastructure that can meet peak demand, even though it is not needed for much of the year. This peak demand can be two or three times the amount of water that is normally used depending on temperature, rainfall, lawns, pools, and so on. Utilities with a large peak demand have higher expenses than those with a smaller peak demand.
Governance. State and local governance influence the number and size of utilities. When water services tend to be fragmented, meaning that there are many utilities serving one geographic area. A single household may be served by different drinking water, wastewater, and stormwater utilities. Each utility has to hire staff for administrative tasks (e.g. customer service, human resources), financial tasks (e.g. accountants and customer billing), and technical tasks (e.g. operating equipment, assessing data). The duplication of staff or these tasks creates additional costs. Learn more about why there so many utilities.
Utility Size. Much of the costs of water infrastructure is fixed, meaning the costs are the same each month regardless of how much water is used. Two identical utilities serving different number of customers can have very different costs per customer. For example, if the total cost to operate the utility is $2,000 a month and one utility has 100 customers while another utility has 20 customers, the cost per person is $20 in the first utility and $100 in the second utility. A 1999 study found that the cost of complying with drinking water regulations is $20 per household each year in very large systems and $145 per household in very small systems.
How can globalization increase financial risk for utilities?
Water infrastructure is built to last 50 to 100 years. Customers pay to finance building infrastructure of 20 to 40 years. People and businesses are mobile and can move quickly (think about how much populations and business have changed and moved within and across the U.S. since the pandemic began in March of 2020). The inescapable fact is that water infrastructure is fixed (both in terms of extent and the amount of water the system is designed to treat and deliver), while populations, businesses, and water use can change quickly and dramatically. This creates financial risk for those who remain in the utility service area as they must bare the ongoing costs to finance and maintain water infrastructure.
Globalization has resulted in more mobile industries and populations. In the past, utilities could largely count on the present industries and populations remaining. Today, there is less certainty, making it more difficult for utilities to manage the risk of investing in fixed infrastructure designed to last for decades. The utility must risk taking on debt over 20 to 40 years with a population that may shrink and leave fewer people to pay the remaining debt. This is like purchasing an apartment and hoping there are enough tenants to pay the mortgage each year. When we look across the U.S. today we see striking diversity in cities in terms of population and income changes over time.
(A) Map shows the decade of maximum population for census designated places located within a metropolitan statistical area. (B) Change in population and income for 3,600 census designated places from 1980 to present.
The infrastructure in our water systems reflects the history of a city and is designed to last for decades. Water infrastructure in Rust Belt cities were built in the late 1800s with thick, cast iron pipes (life expectancy of 120 years). As cities grew, cast iron pipes in the 1920s became thinner along with their life expectancy (100 years) and pipes laid post World War II had a life expectancy of 75 years. The timing to replace pipes in older cities all fall between 2000 and 2030, creating significant cost burdens today.
After WWII, there was an explosion of small water systems in suburban areas to accommodate the swelling Baby Boomer generation and “white flight” (learn more here). These systems were often not built to enduring standards and must be rebuilt when consolidated. Rust Belt cities are plagued by shrinking populations and declining incomes as industry and people moved out, sometimes to a nearby suburb, stranding infrastructure assets. Shrinking populations and/or declining incomes leave a smaller revenue base for utilities to maintain the fixed costs of day-to-day operations, let alone finance replacing infrastructure.
Data from GAO 2002. Water Infrastructure: Information on financing, capital planning, and privatization.
Some cities, particularly in the Sun Belt region, have experienced much of their growth in the last few decades. Rather than replacing already built infrastructure, they are paying for new infrastructure, much of which is sprawling and more expensive to build, maintain, and operate. The risk is two-fold. First, infrastructure must be laid in advance of the population, creating risk for stranded capacity should the expected population growth fail to materialize. Second, economies and jobs may change or transition, along with population, as has occurred in the Rust Belt region.
How can regulations increase financial risk for utilities?
The CWA and SDWA regulations established in the 1970s were essential to ensure public and ecosystem health; yet, given the science and technology at that time, the only way to ensure regulatory compliance was to mandate the adoption of certain centralized treatment technologies. These treatment technologies are expensive. As a result, the federal government initially provided grants to finance the adoption of these technologies so utilities could be in regulatory compliance. There are two direct financial risks associated with regulations.
What tradeoffs do utilities make when funds are insufficient?
Utilities with insufficient funds may struggle to meet their three primary priorities to ensure:
A trilemma occurs when there are insufficient revenues to pursue all three goals completely, the utility must instead find some balance among them. For example, if a utility prioritizes affordability, its revenue may not sustain capital expenditures and service existing debt obligations, putting the utility in danger of default. Alternatively, if the utility ensures fiscal stability (i.e., debt obligations and high credit ratings) and invests in infrastructure and operational robustness, the rates charged per customer may become unaffordable. Finally, a utility may sustain infrastructure and operations, but reduce costs to ensure affordability on remaining customers, and in so doing become fiscally insolvent.
What options are available to assist utilities?
The three primary approaches that utilities have taken to address their financial capability:
Utilities may also seek to diversify their funding portfolio, apply for grants, or decrease costs. Go to Potential Solutions to learn more.
What is water equity?
Equity can be defined as “fairness” marked by impartiality. Equity is achieved when life outcomes are not predetermined by racial, economic or social identities. The U.S. Water Alliance, a forerunner on conversations around water equity, defines equity as just and fair inclusion such that everyone has an opportunity to participate and prosper.
According to the U.S. Water Alliance, equity is achieved when all communities:
Why are there inequities in water services?
Inequity is built on a legacy of social, political, and environmental choices made since the formation of our country that continues to play out today. This is a brief and very simplified history of how these choices have become embedded within the infrastructure of our cities and water systems. Much of this section comes from the 2020 Aspen-Nicholas Water Forum Water Affordability and Equity Briefing Document. The report contains citations for much of the text here.
The industrial era focused on economic development and growth. Unfortunately, much of this growth also harmed entire social and ethnic groups and environmental health. Cities formed around industries to provide infrastructure to house laborers, create energy, and supply water and sanitation. While private companies initially owned much of the water infrastructure in cities, an 1849 Committee on Public Health noted that “… water is so intimately connected to the health of a city, that the municipal authorities should rank this among the most important of their public duties…”. When laws changed so that local governments could take on debt, they began buying water systems from private companies. By 1910, most major cities owned their water systems and water services were provided throughout a city because the risk of epidemics spread by water-borne diseases, such as cholera, was so great that a city could not risk to fail to provide services to all customers, regardless of race (similar to the shut-off moratoria that took place at the start of the COVID-19 pandemic).
Racial inequity became embedded within water and sanitation systems through housing policies. In the 1920’s, population was growing faster than the housing market could expand. This contributed to the National Mortgage Crisis of the 1930s and the Great Depression. To ensure such a housing crisis would never occur again (at least not until 2008), the Federal Housing Administration (FHA) was created. The FHA enabled segregation for over 30 years (1934 to 1968) by guaranteeing the loans of white Americans while refusing to guarantee loans to African Americans or in areas with high African American populations. The systematic denial (directly or indirectly) of various services to residents of specific, often racially determined, communities is known as redlining. Many state and local governments promoted the use of racially restrictive covenants in deeds to prevent the sale of homes to African American families, while private real estate agents used blockbusting to convince white families to leave communities with growing African American populations at a premium and then resold those homes to African American families at inflated prices.
Home Owner’s Loan Corporation maps assigned grades to communities that reflected their mortgage security. Red (redlining) zones were ineligible from government insured loans. Comments often reflect racial reasons as shown for D22 above. Interactive maps are available here: http://dsl.richmond.edu/panorama/#maps
These policies encouraged "white flight” to suburbs and concentrations of African American populations in cities became poorer due to redlining policies that kept wealth away. The ensuing disparity continues today. African American incomes are on average 61% of white incomes and African American wealth is 5% of white wealth. Most middle-class families gained their wealth from home equity, homes that many were able to purchase through FHA policies decades earlier. Since African American families were prohibited from buying homes, buying homes with good interest rates, or buying homes in desirable locations, they could not accrue the same wealth. After 1968 FHA technically allowed African Americans to buy homes anywhere, many homes remained unaffordable to those who lacked the baseline wealth.
Racial segregation at the scale of neighborhoods and census tracts had implications for the development of local water and wastewater utilities after WWII. As residential segregation increased, municipalities could more easily exclude communities of color from water and sewer services through a practice known as under-bounding, whereby municipalities selectively annexed white neighborhoods into the town’s official boundaries while ignoring African American neighborhoods. This type of under-bounding has occurred across the country. For instance:
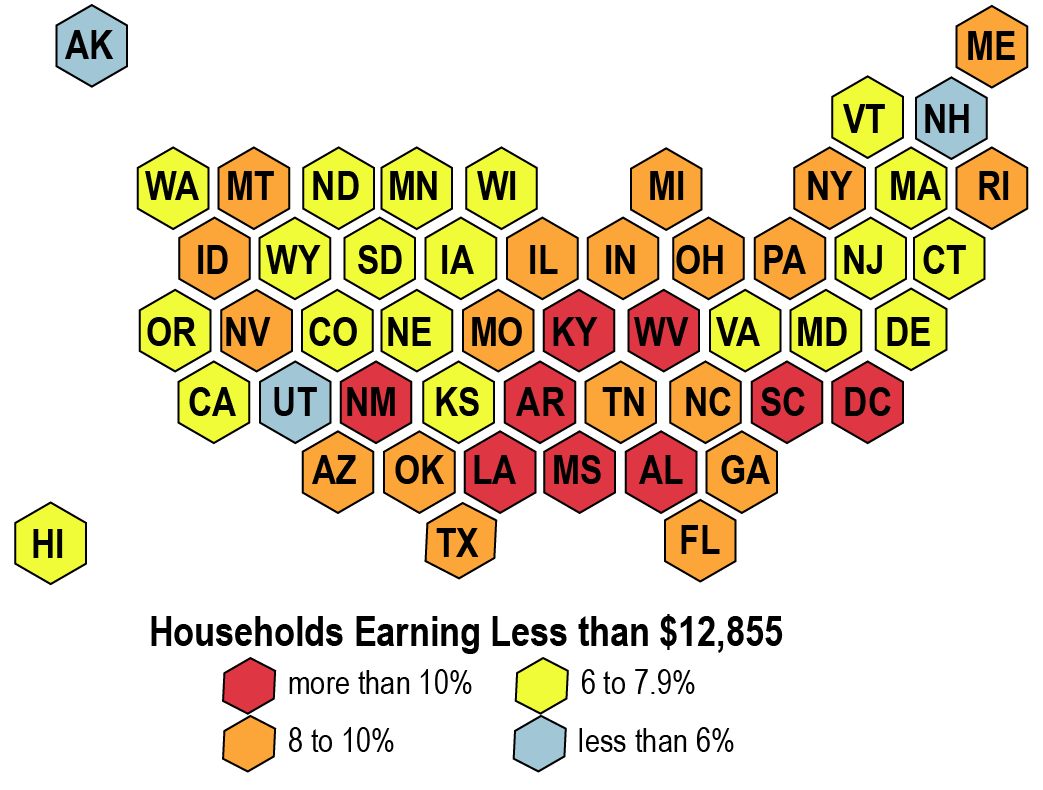
Have you ever wondered while there are so many poor inner cities struggling to afford their water system while surrounded by wealthier suburbs that each have their own systems? At least part of the reason is because white flight moved money to the surrounding suburbs where they could afford to build separate waters systems, removing important financial resources from older utilities. The ability to pay for water systems has become more divided as the racial, and often income, composition of cities became more homogenous (i.e. some systems have a lot of poverty while others have very little). Indeed, in the example of Pittsburgh, 69% of the Pittsburgh Water & Sewer Authority identified as white while that number increased to 94% in the Hampton Shaler Water Authority. As cities have begun to gentrify we see this trend reversing in some areas. Now there are many small, suburbs that are struggling to afford their utilities.
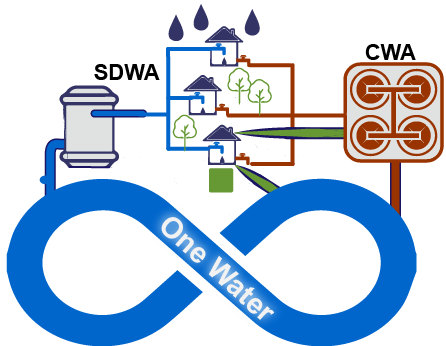
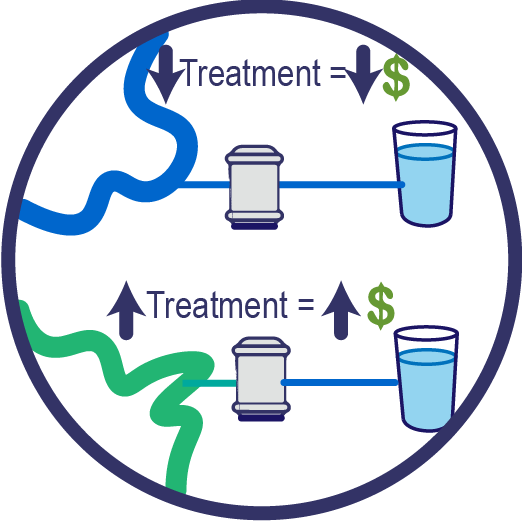
In the early 1970s, Congress passed legislation to protect the quality of our streams and lakes (Clean Water Act in 1972; CWA) and the public health of drinking water (Safe Drinking Water Act in 1974; SDWA). These laws were passed in response to public outcry to 41% of water systems were not meeting health guidelines and jeopardized the health of millions and major rivers were repeatedly catching fire. Both the CWA and SDWA ensure water quality by requiring specific types of treatment to remove specific contaminants (see more).
Both acts included significant federal funding through grants to finance the initial infrastructure needed for local governments to meet these new regulations. Over time, these funds transitioned from grants to loans that have to be repaid. This placed greater financial responsibility onto local and state governments to maintain and upgrade the infrastructure needed for water treatment. While there was an effort to disburse funds equitable, those funds are going to cities (and their utilities) whose capacity to apply for grants and loans were shaped by decades of discriminatory practices. The results is that poorer communities may lack the political power to access safe water supplies and/or regulations are not enforced because the community does not have the financial resources to fix the underlying problem. It remains challenging for small water systems and those serving majority low-income communities to access state and federal dollars.
The Civil Rights movement in the 1960s created a unified voice for social justice. Social injustices are prevalent in housing, employment, municipal services, education, and not surprisingly – environmental protection. In the 1980s, the Environmental Justice movement discovered greater evidence that those suffering from environmental injustices were disproportionately low-income and racial minority groups. These communities are more likely to live near hazardous sites, where they are exposed to greater contaminants and suffer the health and economic impacts). Resulting medical bills are expensive, generating further economic disparities. Well known examples include:
Some environmental inequity is intentional, some began intentionally and is now perpetuated by the inertia of the status quo, and some began unintentionally and continues to be perpetuated.
Environmental injustices start with industry being given the right to pollute before proving harm, rather than having to prove no harm before being given the right to pollute. The negative impacts from industrial pollution are born by the public, particularly low-income and minority communities. Land use controls are
often used to put locally unwanted land uses in minority communities that lack the voice or political capital to advocate for “Not-In-My-Back-Yard.” There is also a history of putting unwanted land uses in minority communities to drive residents out, effectively serving as a “taking” of property. If all communities were given an equal voice and political power, the rate of environmental degradation would likely slow. However, private industries are often the needed employers for many low-income communities, which inhibits many communities from raising concerns as they must choose between employment and health.
Water systems are an essential infrastructure within communities. Our water systems were shaped by the legacy of inequality and environmental injustice that have shaped, and continue to shape, the communities they serve. It can be seen in the water crises that have too often made the news:
The occurrence of massive water shutoffs in major cities have led to repeated outcries for the human right to water. Racism continues to manifest as white communities get green infrastructure projects while communities of color receive grey infrastructure, and those communities of color that do receive green infrastructure often contribute to gentrification. A warming climate with more frequent and intense flood events disproportionately impact poor, minority communities and agricultural lands. Communities facing the greatest water stress and threat to water security include dis-invested urban areas, rural areas, unincorporated areas, and Native American lands.
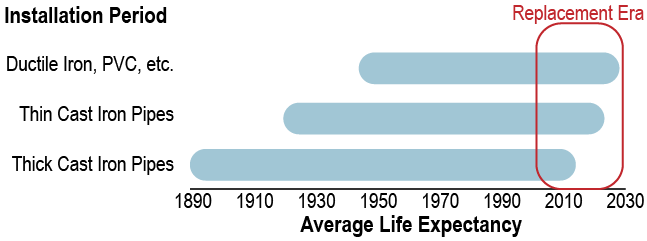
Inequities are embedded within many water systems and it is a "wicked" problem. And there is opportunity as we enter a season of replacing much of our aging infrastructure and revisiting water quality legislation passed more than 50 years ago in light of technology advances and emerging contaminants. We have an opportunity to rethink how we manage water as we modernize our nation's water infrastructure. There is opportunity to provide water services more equitably. The problems of inequity are bigger than water and the solutions need to be too.
What is affordability?
Affordability is the ability to pay for something. Household affordability refers to the ability for an individual household to pay for basic water services needed for drinking, cooking, cleaning, and sanitation without undue hardship. This definition of affordability contains at least two values-based components:
Is water equity the same as affordability?
No - but affordability is a part of water equity. For example, the ability for a household to afford water services is tied to having access to safe, clean, affordable drinking water and wastewater services. Similarly, stormwater services ensure that households are provided adequate drainage and protection from runoff so that communities are resilient in the face of floods...
How does affordability affect utility financial health?
Customers, including residential households, pay for water services. Those payments are how most utilities generate revenue to continue operations and maintenance of water services. Increasingly, utilities are also paying for the replacement of old infrastructure and the purchasing of more chemicals or new technologies to ensure water is safe for drinking and releasing to the environment. This is becoming more expensive as we are discovering more contaminants in our water. As the costs of providing water services increases, the amount utilities charge households increases. The ability of the community to pay higher costs represents the financial capability of the community to afford their utility(ies) providing water services. That is, the ability to finance local water utilities is largely dependent on the financial characteristics of the local community.
Why do rising water costs create affordability challenges?
The cost of water services has more than doubled since 2000, far exceeding price increases for electricity, rent, gasoline, and incomes. The increase in costs have two main drivers.
The costs of providing water services has increased by more than 5% each year since 2000. Around Chicago, 78% water service bills increased faster than household incomes over a 10 year period (see a study of 215 utilities). This is twice as fast as inflation (about 2.1% each year), which is about the same as the increase in median household income (i.e. the buying power is the same now as in 2000). When the cost of water services rise faster than household incomes there is additional risk and concern for the ability of low-income or fixed-income households to afford basic water services.
What happens when households cannot afford water services?
Households that cannot pay all their bills must make tradeoffs with other living expenses such as rent, electricity, and food. When customers are unable to pay their bills, utilities can disconnect services (also known as shutoffs), leaving low-income households without access to water. Shutoffs have negative impacts on households that extend beyond the lack of access to water and sanitation, including:
Many essential services have conventional recommendations about how much of a households income should go to various essential services:
A household would need to make at least $12,855 to break even assuming no assistance. Between 5.5% (New Hampshire) and 13.6% (Mississippi) of households were estimated to earn less than $12,855. Social safety nets (such as Low Income Home Energy Assistance Program (LIHEAP) for energy, Supplemental Nutrition Assistance Program (SNAP) for food, and rental assistance) are administered separately. Yet, a household struggling to make ends meet for one service is likely struggling to make ends meet in all essential services.
What options are available to assist households?
The three primary approaches that utilities have taken to help households afford their water services are:
Utilities may also seek to expand their revenue base, diversify their funding portfolio, apply for grants, or decrease costs. Go to Potential Solutions to learn more about utility options to improve affordability.
The COVID-19 pandemic brought water and its essential role in providing and protecting public health to the forefront. The federal government recently created of a Low-Income Household Water Assistance Program (LIHWAP) similar to the energy assistance program (LIHEAP). This program may compliment or replace the CAPs currently provided by utilities. To learn more visit here.