Using remote sensing data, like satellite or drone imagery, we can infer powerful insights about the energy sector.
Researchers at Duke’s Energy Data Analytics Lab have been pioneering the use of automated object identification and machine learning techniques to assess and map distributed generation, energy consumption, energy access, and other factors based on high-quality aerial imagery.
Researchers began by addressing a critical information gap regarding rooftop solar photovoltaic (PV) capacity and power generation: government statistical collections have focused on central station power, so information about distributed energy production at residential and commercial buildings is scarce.
Project members first compiled, curated, and published a ground-truth data set, then trained image recognition algorithms to estimate the size and location of solar panels. Their methods can be used to improve solar PV estimates and aid government agencies and power grid independent system operators (ISOs) in evaluating the state of distributed PV deployment and use that information for planning purposes to increase system reliability and resilience.
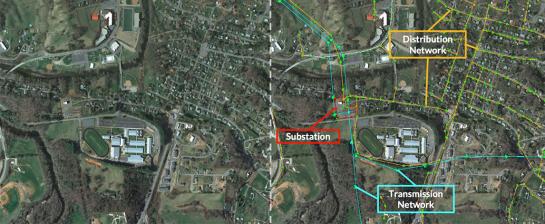
Team members are now conducting related research applying automated object identification and machine learning techniques to assess and map energy access, building-level energy consumption, and infrastructure (e.g., network topologies of electric power lines).
One of the project’s long-term objectives is to create a map of global energy infrastructure that can be automatically updated, and work is well underway on this front. The team’s work could inform other researchers’ efforts to tackle a range of topics beyond energy, identifying and measuring nearly any physical object that’s visible from overhead imagery. For example, these approaches could be used for monitoring, assessing, managing, and predicting urban development or changes in agricultural production.


