
Water services are essential to the health and well-being of every community, from providing safe, reliable drinking water to removing and treating wastewater to managing the flow of stormwater. Yet water affordability and access challenges are growing in the United States as costs for providing these services rise for both utilities and their customers.
The Water Affordability Dashboard is a tool developed by the Nicholas Institute's Water Policy Program to provide a clearer picture of how affordable water services are in the United States. The dashboard helps users answer four questions for each utility:
- Who lives in the utility's service boundaries?
- How much do water services cost?
- How affordable are water services?
- How does affordability change with water usage?
The data and code behind the dashboard are open source to enable others to use the data to ask their own questions, explore solutions, and work toward improved water affordability and equity.
How affordable are water services in the United States? We explored this question by developing the Water Affordability Dashboard. The dashboard was designed to allow users to explore the affordability of water services (drinking water, wastewater, and stormwater) within their utility and across other utilities. You can learn more about the community served by a utility, the cost of water services, and the affordability of those services for a community.

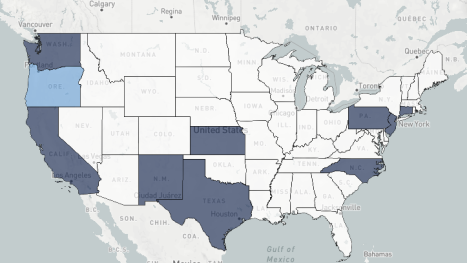
The cost of providing water services is increasing, placing greater financial burdens on individual households and utilities. Five metrics were calculated at multiple volumes of water usage and were applied to 1791 utilities, estimating bills from 2020 rates data, to gauge financial burdens in four states. More than a fifth of the population in 77% of utilities was experiencing poverty, suggesting widespread poverty is a major contributor to utility financial capability challenges. The Income Dedicated to Water Service metric was developed to understand how many households share a similar financial burden, exploring both the depth and prevalence of affordability challenges. Depending on water use, a tenth to a third of households work more than a day each month to afford water bills. This approach and an interactive visualization tool bring greater transparency to understand the scale of affordability and financial capability challenges.


